gViz: Visualisation Middleware for E-Science:
A New Project in the UK E-Science Programme
by Julian Gallop
E-science is intended to enable global collaborations over the Internet and provide access to very large, distributed resources, including data collections, computation and networks of specialised experimental facilities. A new project, funded by the UK E-science Core Programme aims to research and develop visualisation middleware for e-science.
Computer-assisted visualisation is already a key technology for understanding large-scale simulations and observations and, when appropriately configured, will enable collaborations of researchers to analyse the results of evolving e-scientific resources. To be successful at this, visualisation technology needs to be adapted to the evolving Grid, which underpins e-science. gViz, funded by the UK
E-science Core Programme started on August 2002, aims to research and develop visualisation middleware for e-science.
Situations
Using the Grid presents new situations for anyone developing visualisation software:
- An intensive computation on the Grid may generate large results datasets. To be viable, some visualisation algorithms would also need to be run on the Grid.
- Visualizing a large distributed dataset or multiple heterogeneous ones requires access to Grid data management interfaces.
- The existing models for collaboration need to be extended. A virtual organisation may involve dynamic collections of people who may alternate between virtual meetings and asynchronous communication. Also the virtual organisation may not be able to enforce one specific visualisation system.
- There will be a need to integrate visualisation software with emerging Grid technologies, such as GSI to handle authentication, Grid replica management to handle large data files and other Globus facilities.
- Visualization frameworks - whether dataflow networks such as Iris Explorer or interpretative programming languages such as PV-Wave or Java programming systems such as VisAD - can include computational modules when the whole framework is on a single processor or a fixed, limited distributed system. This leads us to ask whether there is a possibility that the framework can control computation modules executing on the Grid.
Work Packages
There are three main subdivisions of work:
- two workpackages aim to grid-enable two very different visualisation systems, Iris Explorer and pV3, which are both exemplars of useful system classes
- another workpackage aims to develop compression techniques suitable for transmitting very large streams of data
- the remaining workpackage aims to build up appropriate XML languages for describing the structure and format of data to be analysed and for processing tasks. In addition to the technical definitions, this workpackage will, early in the project, run a workshop on XML for visualisation.
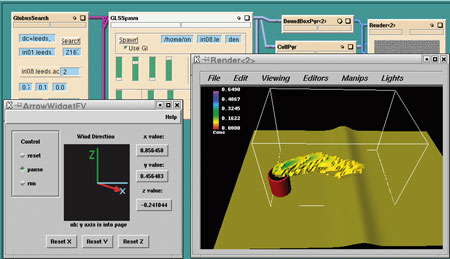 |
| Screenshot of a session using the Iris Explorer visualization system accessing a Grid application. |
The Figure shows some earlier work carried out at the University of Leeds (the lead partner in the new project) as part of a previous UK e-science demonstrator project (see http://www.visualization.leeds.ac.uk/CovisaG/). This shows at a basic level that it is possible to communicate with the Grid using the framework provided within an off the shelf visualisation system. The top of the figure shows some modules connected together, two of which are wrappers for Grid services. The bottom of the figure shows a rendering window which shows a case study of hazardous pollutants. This work was demonstrated at the opening of the UK National e-Science Centre in April. The new project will need to go on to exploit Grid capabilities including security, flexibility, symmetry between collaborators and extensibility.
Also relevant to the new project is previous work on component-oriented visualisation carried out by CLRC RAL and the University of Lancaster (project Visual Beans (http://www.acu.rl.ac.uk/ VisualBeans/).
Applications
The intention is to develop techniques and tools which are usable across a wide range of applications. However within the project, certain applications will be used as testbeds and these include heart modelling (in computational biology) and climate prediction.
Partners
The academic partners are the University of Leeds (lead partner), the University of Oxford, Oxford Brookes University and CLRC Rutherford Appleton Laboratory.
In accord with the funding rules, the industrial partners make, in kind or directly, a total contribution which matches the funding received from the e-science programme. These partners are IBM UK, Nag, and Streamline Computing.
Followup
This new project may be of interest to those who are developing Grid applications which require visualisation or those who are developing more advanced Grid tools and believe that visualisation software may make use of them. It would be useful to hear from European researchers who are interested in this project.
Links:
http://www.bitd.clrc.ac.uk/
and follow links to R&D then Visualization Middleware.
Please contact:
Julian Gallop, CLRC
Tel: +44 1235 44 5569
E-mail: Julian.Gallop@rl.ac.uk
|