The Discourse Meter: An Instrument for the E-discourse
by Viviane Wolff
The discourse meter for the discourse support system 'dito', developed at the Fraunhofer Institute for Autonomous Intelligent Systems (AIS), will help participants to become aware of the current state and progress of an on-going e-discourse. It remains to be proven, however, whether the effectiveness and efficiency of the e-discourse will be increased by using this instrument.
Through the continuing implementation of e-government solutions, it is likely that the participative elements of e-democracy will grow in importance. In particular, citizen participation will increasingly take place via e-discourse (electronic discourse). It is anticipated, however, that with the acceptance and growth of e-discourse, a level of complexity that is problematic for participants will soon be reached. This complexity will result from the large number of participants and contributions and the associated diversity of opinion, and it will require a measure of control to be exerted over all participants. The discourse meter is an instrument designed to support discourse awareness, making the process more transparent for participants, through the classification and evaluation of contributions. Complex discourse events will become more visible by the use of query mechanisms, monitoring and the use of graphs and metaphors.
Discourse Awareness
It is necessary for moderators to have access to information about participants' activities in order to efficiently and effectively moderate e-discourses. Information is also required by participants, who need to know about discourse events in order to take part in a concerted discussion. Since the focus on discourse awareness varies depending on the e-discourse phase and the participants' view, our discourse awareness tool is divided into five areas: argumentation, communication, moderation, location and navigation awareness.
Argumentation awareness asks, "What will the outcome be?" Answering this question provides information about an argument's structure and its progress. To this end, a discussion is analysed in order to extract indicators which can serve as measures of opinion and progress with respect to the state of the argument.
Location awareness is concerned with the question: "Where specifically do I go?" It points out, for instance, active and passive discussion sites to the moderator and participants respectively. Location awareness also provides information on how many participants reside in a given discussion section, as well as whether there are any currently published contributions and during which timeframe those contributions were made.
"Who is taking part and how?" This issue is analysed through communication awareness, which deals with participants' communication behaviour and detects whether participants are showing interest in each other and who is talkative or reserved.
Moderation awareness evaluates the question: "What does the moderator do and what effect does he/she have?". Moderators do not generally receive any direct feedback on their actions. Moderation awareness counters the lack of physical presence of the participants by providing an opportunity to check the effectiveness of the moderation. For example, has repositioning a 'dead' contribution or a call for a more lively discussion revived the discussion?
Navigation awareness answers the question: "What is the navigation behaviour of the participants?". This provides information on how an individual participant moves within an e-discourse.
Discourse Meter
The discourse meter consists of four components: the event recorder, queries, monitoring and the visualiser. The first component records actions in the form of discourse events. Such discourse events include making a contribution, entering into a discussion section or responding to a certain contribution. The query and monitoring components aggregate these discourse events, which the visualiser then shows as a graph or metaphor. While queries can provide information on past discourse events, the monitoring component is responsible for current discourse events within the hour and minute range.
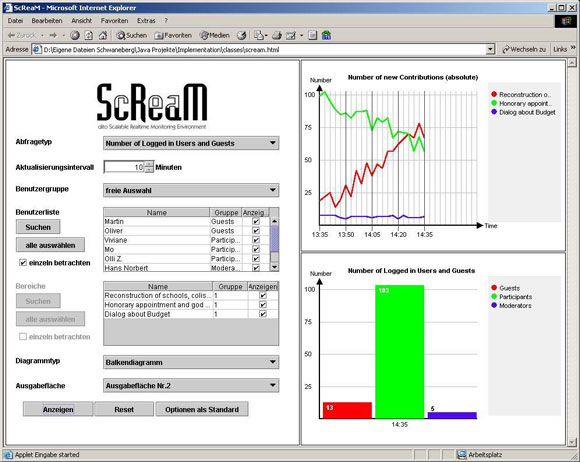 |
| Monitoring discourse events. |
Queries provide indicators and key numbers from various discussion sections in any given time period. Aside from determining the absolute number of readers and writers of contributions, a query can also calculate the ratio of these to emphasise the activity within an e-discourse. Furthermore, a query reports on the progress of an argument. If at the beginning of an e-discourse there are more questions than answers, then as the discourse progresses, stands will be taken on both sides of the argument. In this way its status can be made clear - whether it is in full swing, has not even started yet or has petered out so that the moderator can close it down.
The monitoring module is equipped with a configuration capability that allows it to accommodate various moderation preferences and discourse phases. Some moderators may be more interested in the actual communication among participants, while other moderators take a greater interest in the argumentation process. A moderator may also choose different configurations in order to control the phases of the e-discourse. Most moderators will most likely attend to the participants whom they have registered for the e-discourse at the beginning of the session. As the e-discourse continues, the moderator will be able to watch as the participants make their own contributions.
Each participant has a restricted view of the discourse meter, meaning participants' privacy can be protected. The user interface of the monitoring module is shown in Figure 1. The left side of this figure shows the input for the configuration parameter, and on the right, the individual output appears in the form of graphs. This example shows which participants are currently logged in, and the number of new contributions processed by the visualiser within the last hour.
Link:
http://zeno8.ais.fraunhofer.de/zeno/web
Please contact:
Viviane Wolff, Fraunhofer AIS
Tel: +49 22 4114 2665
E-mail: viviane.wolff@ais.fraunhofer.de
|