
 This issue in
Time Profiles Rreveal the Structure of Sleep Stages in the Neonatal EEG
by Vladimír Krajca, Svojmil Petránek, Karel Paul and Milos Matousek
In an article published in ERCIM News 29 the authors described the methodology for a computer-assisted long-term electroencephalogram (EEG). In this contribution, they show how this methodology could be used for structural description of sleep stages in a neonatal EEG. The procedure is based on the processing of time profiles computed by adaptive segmentation and subsequent classification into several classes. Time profiles reflect the EEG structure over time and may be used for detection of changes in the neonatal sleep stages.
EEG is one of the most important methods of studying the maturation of the child brain. The aim of the study was to evaluate the possibility of distinguishing between the EEG activity of quiet and active sleep in both full-term and pre-term infants using the automatic method. This is based on adaptive segmentation, feature extraction and subsequent classification.
The EEG recordings of 21 healthy sleeping newborns (ten full-terms and eleven pre-terms) were processed. To take into account the non-stationary behaviour of the signal, the features were extracted from piece-wise stationary segments detected by an adaptive segmentation algorithm, which used the two sliding windows to detect the change of stationariness in the signal. The most important parameters for distinguishing the EEG activities between both sleep states were the amplitude variance, the parameters describing the duration of the segments, and power in the frequency bands delta, theta, and alpha. The classification was performed by cluster analysis (k-means algorithm). The time profiles, that is, the function of class membership over time, were plotted for each EEG channel. The EEG was also evaluated by an experienced electroencephalographer by visual inspection.
|
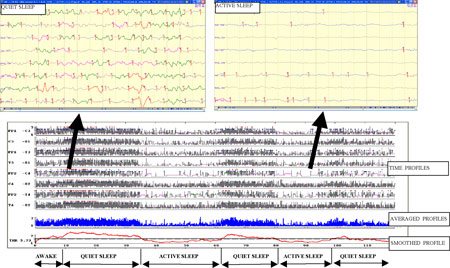
The example of the signal processing of ninety minutes of neonatal EEG (time profiles and two pages of recordings) is shown in Figure 1. The segment boundaries are indicated by short vertical lines showing the change of stationariness of the signal. The segments are identified by a colour and relevant class number
The time profile is the function of class membership of each EEG segment depending on the time. The awake period and quiet and active sleep stages can clearly be seen. The signal graphoelements were divided into several classes reflecting the occurrence of the basic EEG graphoelements over time. Later we also exploredwhether such time profiles can be used for detection of neonatal sleep stages. In order to obtain the detection curve, the time profiles (their class membership) were first averaged (the blue curve in Figure 1). The resulting curve was then smoothed by a simple moving average filter (the red curve), producing the final detection curve, which can be compared to the threshold.
The study revealed that this method of automatic analysis describes the electroencephalogram of neonates with sufficient accuracy. The time profiles reflect the difference in EEG activity between quiet and active sleep. The structural description of the multichannel EEG of the newborns provides a good basis for a fully automatized method of sleep-stage identification. This work was supported by grants IGA MZ _R NF7511 and NF7586.
Link:
http://www.ercim.eu/publication/Ercim_News/enw29/kraica.html
Please contact:
Vladimír Krajãa,
Faculty Hospital Na Bulovce/Department of Neurology, Prague, Czech Republic
Tel: +420 2 6608 2307
E-mail: krajcav![]() fnb.cz
fnb.cz