MaC: A Testability Analysis Tool for Reactive Real-Time Systems
by Huy Vu Do, Michel Delaunay and Chantal Robach
The MaC tool has been developed for testability analysis of graphical designs of real-time systems. This tool helps the designer to detect parts of a system that are difficult to test, and identifies the minimum set of test objectives that are useful during the test phase.
Today, reactive real-time systems are widely used in many safety-critical domains: automotive, aerospace, nuclear and so on. These systems require a very high level of confidence, since a failure in any one of them could be a disaster. In the development of these systems, validation plays an important part, since it ensures confidence in these systems. The validation process is divided into two activities: the proof of a part of the system, and the testing phase that reveals faults in the system. However, testing of reactive real-time systems is expensive in terms of complexity and cost. This is where a testability analysis can help, by appraising the ease with which testing can be undertaken.
In the development of reactive real-time systems, the designer can use a graphical environment (eg Scade, Sildex, Simulink) to describe algorithms. In this method, a system can be hierarchically viewed as a diagram of operators or subsystems. A subsystem is also a composition of operators. The designer can simulate the system and analyse the results. When a design is justified, it can be converted into instrumented code for prototyping. Hence, the overall design process is reduced.
However, in complex, large-scale systems, it is difficult to analyse the weaknesses of the architecture of real-time systems. A system can be hierarchical, and potential faults can be hidden in subsystems. To solve this difficulty, we propose an automatic method of analysing the testability of graphically described systems. Our method, which is derived from the SATAN technology (System's Automatic Testability Analysis), consists in analysing the data flow of systems.
The SATAN Technology
The SATAN technology was developed for analysing the testability of data-flow systems. With it, elementary functions of the system can be identified, test objectives determined, and the testability values of each component in the system computed.
This technology uses an Information Transfer Graph (ITG) to model a data-flow system. From the ITG, elementary functions of the system are identified. Test objectives can then be obtained by applying one of two strategies: the progressive structural strategy (Start-Small) that is suitable for the progressive detection of faults during the validation process; and the cross-checking strategy (Multiple-Clue) that is suitable for diagnosis during maintenance. These strategies allow the number of test objectives to be reduced while ensuring that all components of the system are covered.
 |
| Figure 1: Testability values of a component. |
In this technology, the testability is defined as a combination of two values: controllability and observability. The controllability expresses the easewith which the input values of an internal component can be controlled through the input values of the system. The observability expresses the easewith which the results of an internal component can be observed at the outputs of the system (see Figure 1). These values are normalised between 0 and 1.
If a component has a low value of controllability or observability, it is a weak point in the system in terms of testing. This allows the designer to then modify the algorithm in line with these values.
The MaC tool
Through a collaboration between the MBDA company, the Free & Alter Soft company and the LCIS laboratory, we have developed the MaC tool based on the SATAN technology. This tool allows the testability of components in a system to be analysed from graphical descriptions of systems developed with Scade, Sildex, or Simulink. Inputs of this tool are graphically described algorithms of reactive real-time systems. Since we know that a system can be hierarchical, the system description must be flattened before applying the SATAN technology. Users can choose a level for the flattening. Different functionalities of the SATAN technology, such as strategies, can be activated via the graphical user interface (see Figure 2). The testability analysis can be activated step by step. With a detail log and a status report, users can follow the execution of the MaC tool. After the analysis, a report in HTML format is created. This report contains a hierarchical table of the testability measurements and labelled operator diagrams. Each labelled operator diagram corresponds to an operator diagram of the system. Users can easily find the measurements for each component.
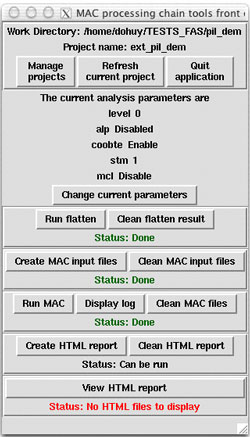 |
| Figure 2: The graphical user interface of the MaC tool. |
An example of application of the MaC tool is shown in Figure 3. In this example, we apply the MaC tool to analyse the testability of a Simulink model (see Figure 3a). We obtain a table of values (see Figure 3b) and a labelled operator diagram (see Figure 3c).
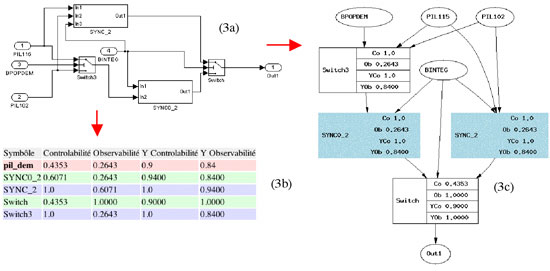 |
| Figure 3: An example of applying the MaC tool on a Simulink model. |
The MaC tool has been validated on industrial examples provided by the MBDA company. The results show that the testability analysis gives useful information for the design and the validation of these examples: operators with low testability are identified and the minimum set of test objectives is determined.
Using the MaC tool helps the designer to take testing into consideration very early in the design phase. It therefore helps in reducing the cost of validation and in increasing the reliability of the system.
In future work, we intend to improve the ergonomics of this tool, and extend this tool to other graphical development environments.
Please contact:
Huy Vu Do, Institut National Polytechnique
Grenoble, France
E-mail: Huy-Vu.Do esisar.inpg.fr esisar.inpg.fr
|