| |
Towards Useful Tools for Estimating Railway Infrastructure Capacity
by Jan Ekman
With the aim of supporting the process of adapting the railway infrastructure to present and future traffic needs, SICS is developing methods and tools for estimating railway capacity. The project is supported by Banverket, the Swedish National Rail Administration.
Traffic on the Swedish railway network has increased considerably in recent years, and large investments in railway infrastructure are planned in order to meet the expected need for higher railway capacity. When new infrastructure is designed, it is important for the quality of the transportation system that the infrastructure and the traffic solutions are adapted to each other. For this purpose, new standards, methods and tools are required for precise analysis of infrastructure capacity.
Our starting point is that railway traffic is to be regarded as a set of traffic patterns that are repeated on sections of the track system. From this standpoint we have developed a method for analysing capacity in signalling design. Consider the left side of Figure 1, which depicts an instance of periodic traffic, by which we will describe the method. Each period of this repeated traffic pattern consists of three trains (w, e and f) traversing a single line with three meeting stations (ms1, ms2 and ms3). Each of the advances of the two trains w and e are separated into two parts, w1, w2 and e1, e2 respectively, by the waiting points at which the trains wait for other trains to pass. We use the term 'cleared paths' to indicate the paths of the trains produced by this separation. Waiting points and cleared paths are the basic concepts on which the method relies.
The 'traffic pattern graph' on the right in Figure 1, shows the priorities of the movements on the cleared paths in the traffic pattern. There is one node in the graph, for each 'cleared path'. Straight arcs concern prpriorities in one and the same period, and bent arcs concern priorities in two consecutive periods. For instance, the bent arc from e2 to w1 means that the movement e2 in period n precedes the movement w1 in period n+1. The arcs only concern direct priorities.
 |
 |
| Figure 1: Traffic pattern and traffic pattern graph. |
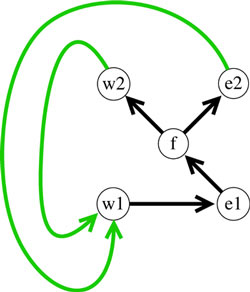
The compact model of the traffic pattern given by the traffic pattern graph is the first step in the construction of a set of conditions to be used for estimating capacity. The next step in this construction is the addition of arcs for movements that may directly impede on each other. This is followed by the decoration of each arc with the shortest length of time between the starting times of the two movements. The result, for some invented shortest durations between starting times, is the 'conflict graph' shown in Figure 2.
 |
| Figure 2: Conflict graph. |
Each arc in the conflict graph is a condition. For instance, the bent arc of weight 25 from f to e1 represents the condition that the movement e in period n + 1 may not start earlier than 25 time units after the start of the movement f in period n. Given the conflict graph, the minimum period is obtained by analysing the circuits in the conflict graph, where a circuit consists of one or more arcs. The cycle mean of a circuit is the sum of the weights divided by the number of bent arcs, and the minimum period of the traffic pattern equals the maximum of the cycle mean for all circuits in the conflict graph. The maximum cycle mean in a conflict graph can be efficiently computed, with running time O(n3) , at worst, with n as the number of cleared paths. The minimum period for the considered traffic pattern is 50, where the circuit of weight 100 consisting of the edges (w1,w2), (w2,e1), (e1,e2) and (e2,w1), two of which are bent, is a critical circuit. That is, a critical circuit is a circuit with cycle mean equal to the maximum cycle mean.
To sum up, this method allows us to decide the minimum period for a given traffic pattern on a railway section. This is in itself useful for deciding on the best infrastructure for the planned traffic, given, for instance, by a timetable. The method applies to precise examination of infrastructure, such as considering the effects of adding and altering the positions of track signals. The method suggests that capacity of a railway section can be estimated as the overall minimum period for a collection of automatically generated traffic patterns, each of which satisfies some requirements on the traffic. It may also be of interest to know, for a given fixed infrastructure, which traffic solutions are suitable and which are not. In such a case, rather than simply estimating the capacity, it is also necessary to determine which traffic patterns are badly adapted to the infrastructure, ie, those traffic patterns with a long minimum period. Without paying any attention to robustness of the traffic system, analysis of capacity would be merely of theoretical interest. One way of dealing with robustness is to add default buffer times to the course of events on which the model is built, making this set of buffer times the robustness criterion. However, the model of the traffic pattern given by the conflict graph is well suited as the basis for robustness analysis, as for instance stability analysis and delay propagation.
Please contact:
Jan Ekman, SICS
Tel: +46 8 633 15 65
E-mail: jan sics.se sics.se
|