

ERCIM News No.44 - January 2001 [contents]
ERCIM News No.44 - January 2001 [contents]
by Robert van Liere
Visualization is an important tool to provide insight in the structure and functioning of time dependent 3D processes in live cells. In cooperation with the Swammerdam Institute for Life Sciences in Amsterdam, CWI has applied a number of visualization techniques to analyze the condensation and decondensation of chromosomes during cell division. To this end, an interactive VR enabled visualization system specially equipped for time dependent 3D data sets was developed.
In order to understand the biological processes underlying control of gene expression, the organization of the cell nucleus must be studied. Time dependent volume data describing specific processes of the living cell are available by now, but their structural analysis in space and time is next to impossible with traditional techniques. Whereas 3D volume data may be analyzed with traditional volume rendering and isosurfaces, the visualization of complex 3D time dependent multi channel data demands a combination of techniques not found in standard systems. Therefore a special visualization system, called Proteus, was developed. Next to basic support tools it comprises an open ended architecture in which application specific demands can be easily incorporated, and can be used in fully immersive, semi-immersive, and desktop environments.
Using 3D confocal microscopy, biologists have been able to produce time dependent 3D data sets of DNA/chromatin in the nuclei of living cells. Time series of 3D images are made of the process of decondensation of the chromatin after cell division (mitosis). During mitosis chromatin is densely packed in chromosomes. After mitosis, part of the chromatin decondensates to form a new nucleus. The data set consisted of a series of fifty stacks containing thirty optical sections of 256x256 voxels each. The voxel size is 90x90x700 nanometer. The time step between scans ranges from 30 seconds in the beginning of the process to 180 seconds at the end. The required storage size was 98 MB.
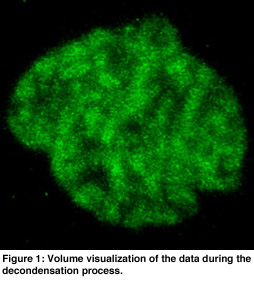
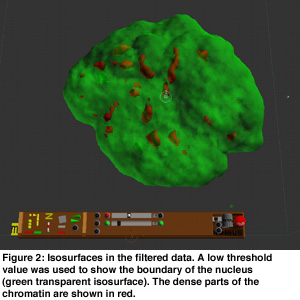
In order to get an overview of the data, volume rendering was used because this presents the data in a natural and intuitive way (see Figure 1). This gave insight into the global structure of the data. Visible tracking of the structures in the nucleus is complicated by the overall movement and rotation of the cell nucleus and by noise of the data. Hence, the movement of the cell was filtered out using a center of mass estimation, and the noise was suppressed using a low pass filter. Isosurfaces were useful for analysis of the motions of dense parts in the chromatin data. Transparant isosurfaces were introduced to show the boundary of the nucleus using a low iso-value (see Figure 2). These dense parts moved apparently mainly outward, without much reorganization inside the nucleus.
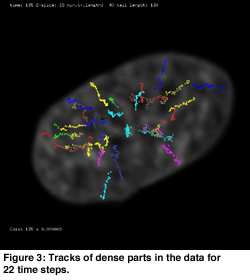
Automatic object detection was combined with manual editing. The extensibility of the Proteus system allowed for integration of the feature detection and tracking algorithms into the visualization of the raw data. The tracks found can be manually edited using direct manipulation in places where the algorithm was not capable of calculating the tracks. In many cases the found tracks could be improved by visual inspection. By using the tracking algorithm in combination with the track editing tool the main tracks of dense chromatin spots were found (see Figure 3).
The following lessons were learned from this case study. First, the visualization system used must be flexible enough to cooperate with the other parts of the process. Hence, Proteus was designed as an open system in which the output or other analysis tools can be incorporated. Second, since each visualization technique has its strengths and weaknesses, a whole repertoire of techniques should be offered for use. Finally, for visualization to be an effective tool for collaboration and communication as well, results found in a highly sophisticated environment should be recordable, such that the results can be reproduced for discussion and publication.
Please contact:
Robert van Liere - CWI
Tel: +31 20 592 4118
E-mail: robertl@cwi.nl
http://www.cwi.nl/~robertl/