

ERCIM News No.44 - January 2001 [contents]
ERCIM News No.44 - January 2001 [contents]
by Ivan Herman
Graph visualization is an emerging branch of information visualization, applicable when data possess inherent relations, so that they can be represented by the nodes of a graph, the edges representing the relations. A research group at CWI focuses on cases where graphs form the fundamental structural data representation. The group has developed the Java-based graph visualization system RoyËre, in co-operation with partners at the universities of Bordeaux, Montpellier, and Bath. The system is freely available for research purposes.
Graph visualization has many areas of application. Systems which can be represented as graphs include hierarchies of files, taxonomies of species, Web site maps, evolutionary trees, and genetic maps. Other applications include class browsers, compiler data structures, state-transition diagrams, semantic networks, PERT diagrams (project management), VR scene graphs, and document management systems. As the information is not always purely hierarchical, more general graphs than trees need to be studied.
A key issue when visualising graphs in information visualization is the size of the data. Many applications require analysis of graphs with several thousand nodes and edges. Large graphs pose several difficult problems. Even if all elements can be displayed, one may obtain an overall indication but the graph is difficult to comprehend (nodes and edges cannot be distinguished).
CWI has developed innovative techniques to navigate, to filter, and to create abstractions from such graphs, in order to make them usable in practice. A key feature is the use of metrics, as a measure associated with a node or an edge. The idea is to define the relative importance of a node or an edge with respect to some semantics. The measure can be application specific or based on graph structure, for example the degree of a node (= the number of adjacent edges), the size of a subtree, or the flow of information in a directed graph.
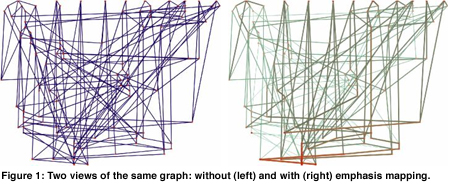
Such metric values can be translated into visual attributes like colour and saturation. A technique that we find useful renders an edge with continuously shaded colour reflecting the metric values of the nodes at its endpoints. In this approach, higher metric values are considered more interesting and are assigned higher saturation values. The result is an emphasis on the most ëinterestingí nodes and edges (see Figure 1). Metrics can also be used to hide elements with low values, thus emphasizing the more important elements in a tree (ësemantic fisheyeí).
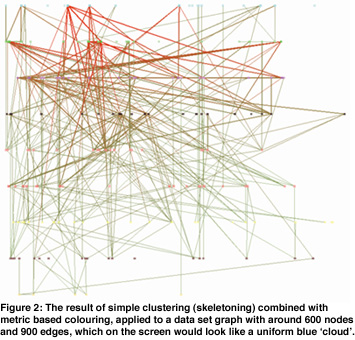
Another use of metrics lies in the partitioning of a large data set by subdividing the corresponding graph into subgraphs of manageable size. This technique is vital to navigation in large graphs and to identification of important relations among elements. It is particularly important when no ënaturalí division into subtrees exists. Based on the idea of subdivision, innovative interaction techniques could be developed to enhance the userís possibilities in analysing the underlying data structures (see Figure 2).
Visual attributes or clusters are generated automatically. If the metric values are uniformly distributed, a simple linear mapping to, for example, colour saturation will do. If the distribution is not uniform, the statistical behaviour of the metric values should be taken into account. We have developed techniques to describe the necessary distributions for the various metrics, and apply them as part of the navigational tools. Knowledge of the exact statistical behaviour would save us the process of finding an approximation function or building a look-up table. Unfortunately, some of these behavioural descriptions are very involved , and require a strong foundation in mathematics. Here lies a potential field of fruitful cooperation between the visualization and the mathematics communities.
All our ideas are incorporated in the graph visualization system RoyËre, which can be used as the basis for further developments.
Links:
CWI’s Information Visualization Project: http://www.cwi.nl/InfoVisu/
Please contact:
Ivan Herman - CWI
Tel: +31 20 592 4163
E-mail: ivan@cwi.nl
Scott Marshall - CWI
Tel: +31 20 592 4164
E-mail: scott@cwi.nl