The Responsive Workbench for Visualization of Fluid Dynamics
by Gerold Wesche, Jürgen Wind and Martin Göbel
GMD and Daimler-Benz AG developed a visualization system for Fluid Dynamics in a Virtual Environment, that supports the evaluation and exploration of huge simulation data sets in a highly interactive way. The system has the following two key features: First, the visualization of the simulation data and the interaction occur through a virtual environment, called the Responsive Workbench. The Responsive Workbench (Registered Trademark, GMD, 1996) is a high resolution stereoscopic table-top display, which supports head and hand tracking. Secondly, we tightly coupled the SGI Onyx graphics workstation, that drives the Workbench, with an IBM SP2 parallel computer via a HIPPI (High Performance Parallel Interface) connection.
The user specifies visualization parameters, like insertion points of streamlines, using six degree of freedom input devices. These parameters are continuously send from the SGI to the IBM SP2. In turn, the IBM SP2 computes rapidly high resolution visualization primitives, like streamlines or iso surfaces, and sends these back to the SGI, where they are displayed at high frame rates.
Postprocessing of numerical simulations generally uses specific postprocessors which are mostly tailored to the application field. Currently, all of these very powerful visualization systems are desktop oriented, applying mouse, keyboard and spacemouse interaction. Requirements like high resolution stereo representation or intuitive interface technology are rarely fulfilled by most of these systems. Many of them are not able to deal with unsteady simulation data.
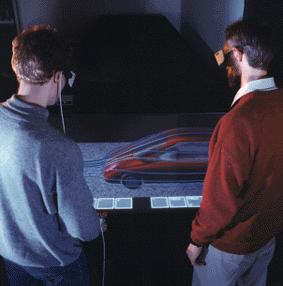
In our system, we apply a non-immersive virtual environment, called The Responsive Workbench, designed for special classes of end users and adapted to the needs of engineers. Data visualization is changed to a highly interactive, virtual data exploration. The Responsive Workbench consists of a horizontal projection area with the extend of about 170 by 120 centimetres, over which three dimensional virtual scenes and control tools appear, viewed through stereo glasses. With input modules like data gloves and stylus the users can interact with the virtual objects, manipulating them as if real, see Figure1.

Figure 1: Visualization of air flow on the Responsive Workbench.
The work action is virtual. The control tools implement complex actions that can be easily achieved by intuitive movements of the users hand. Each control instrument is represented as a small virtual object that can be activated by grabbing it with the hand and moving it onto an object, which is to be manipulated. Rotations of objects then can be done just by turning the hand. The zoom operation is accomplished by simple up and down movements of a small virtual magnifier, which has been grabbed by the hand.
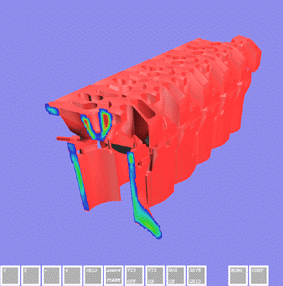
Several visualization methods were implemented or extended for the use on the Responsive Workbench. They can be interactively chosen and combined arbitrarily. The basis for locating positions and for interaction is the stylus, a tracked control pen. In addition to this, a small virtual arrow, indicating the position of the stylus in the simulation area, is displayed. The stylus serves as an injector for particles and streamlines into the region of air flow, for controlling cutting planes (see Figure 2) and selecting parameters.

Figure 2: Interactive cutting plane.
Parallel Preprocessing of Isosurfaces
High numerical as well as graphical computation power is needed to ensure interactivity and real time rendering. Therefore we linked a parallel computer (IBM-SP2) to the graphics system (SGI Onyx RE2) via a HIPPI connection of 800 MBit/s. The parallel computer is used for preprocessing the results of simulation computation, creating appropriate visualization primitives for rendering. An application of this are isosurfaces that are generated on the parallel machine, allowing a deeper insight into the structure of scalar data. Polygon lists are transmitted to the graphics computer over the HIPPI connection and rendered. A scan conversion module for data preprocessing also runs on the parallel computer to reduce the response time for the user to get the result.
Cutting Planes
Scalar volumes like temperature or pressure fields can be visualized on interactively positioned cutting planes controlled by the hand. The color coded visualization of the scalar quantity is updated every time the user changes position and orientation of the plane. Special texture hardware is used to implement this feature without any noticeable latency. A regular 3d-grid is required for this method of visualization that fits into the texture-memory of the hardware. The texture memory size is 16 MByte, permitting a 3d-texture with a resolution of, for example, 256 by 256 by 256 using 8-Bit texels and a lookup-table. For a satisfying quality an appropriate technique for the conversion of the simulation-results into the grid is essential.
To convert the Finite Volume elements into a regular 3d-grid we use a method called 3d-scan-conversion. One can imagine this technique as analog to the rasterization of a 2d polygon onto a screen. The values at the element-vertices are interpolated into the region of the grid, which is occupied by the element. This visualization technique is even usable for unsteady fields, but during the animation of the sequence the textures have to be reloaded into texture memory because nearly the whole memory is filled with the data of one timestep. This may cause animations which are not completely smooth.
The cutting plane tool has proven to be very useful in practice. Although, allowing interactivity, we are using regular grids, the accuracy of the displayed plane is very good, because of the possible texture memory resolution. Compared to this, the computation of cutting planes in the original simulation grid is very time consuming and can't be achieved at interactive rates.
Vector Field Visualization
In a 3D environment, interactive cutting planes are also applicable for the display of velocity vectors. Small vector objects are computed in real time and emanate from the plane in the direction of the velocity. In addition to this, streamlines and particles are injected by the stylus. The streamlines can be colorized according to a certain scalar quantity, eg temperature or pressure.
Visualization of Unsteady Data
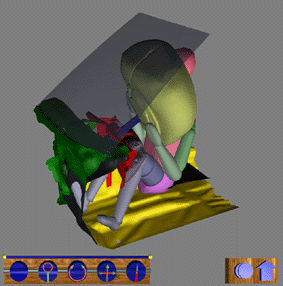
Another useful feature is the visualization of sequences, showing crash tests (see Figure 3), airbag simulations or injection processes together with precomputed particle streams. If the main memory is sufficient, the whole sequence can be loaded and studied over the Workbench, while it is possible to adjust the presentation speed of the process or to manipulate the geometry by transforming it or grabbing parts by hand.

Figure 3: Crash test visualization.
Applications
The visualization system for fluid dynamics pointed out before is currently used by our project partner Daimler-Benz on the Responsive Workbench. The developers and engineers, that have been using the system the first time, were convinced of the usability of the system for 3D-visualization. Evaluating their simulations, they became much deeper insight into the structure of, for example, the velocity field inside a cylinder during the injection process. They realized the orientation of vortices in the space, which was very difficult for them to recognize with their standard visualization tools.
Please contact:
Gerold Wesche - GMD
Tel: +49 2241 14 2708
E-mail: gerold.wesche@gmd.de
Jürgen Wind - GMD
Tel: +49 2241 14 2708
E-mail: juergen.wind@gmd.de
Martin Göbel - GMD
Tel: +49 2241 14 2366
E-mail: martin.goebel@gmd.de
