ERCIM News 64January 2006Contents 
This issue in pdf Subscription Archive: Next issue: April 2006 Next Special theme:
|
by Daniel Gillblad and Anders Holst
Researchers at SICS have developed a new framework for statistical modelling, which can effectively describe complex probability distributions over a large number of attributes of mixed type. This can be very useful when building adaptive models of complex real world data.
In emergent computing it is important that real world data are modelled in an appropriate way. This means that the model should represent the relevant aspects of reality in a way that is robust, adaptable and data driven. Simple linear regression models are usually not powerful enough to model complex real world data. We have developed a very general framework for statistical modelling, which can effectively describe complex probability distributions over a large number of attributes of mixed type.
The Hierarchical Graph Mixtures Framework
The modelling framework, Hierarchical Graph Mixtures, is based on a combination of mixture models, probabilistic graph models, and Bayesian statistics.
In a mixture model, a complex distribution is represented as a sum of simpler distributions:
![]()
In a graph model, a distribution over many attributes is expressed as a product of factors, each involving distributions over much smaller number of attributes:
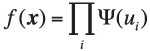
By hierarchically combining mixture models (sums) and graph models (products), we have a powerful modelling framework capable of expressing very complicated distributions.
Figure 1 shows a simplified view of the complementary nature of mixture models and graph models. A mixture splits the data into subsets of samples, {γ1, γ2} etc. The graph model instead groups attributes, eg {χ1, χ2} and {χ2, χ3}. By building hierarchical models, we can construct arbitrary groups of attributes and samples. For example, we can use different dependency structures within different clusters of the data.
|
The meta-structure of the model (ie where to use graphs and where to use mixtures) is specified manually. Thereafter all parameters of the model are trained from data, including graph structures and mixture partitions. To make training and usage of arbitrary hierarchical structures work, all operations on mixtures and graphs are expressed in such a way as to be independent of the form of the sub-distributions. This also provides for a straightforward implementation of the modelling framework. All parameter estimation is performed using Bayesian statistics to ensure stability.
An Application Example
An example of the application of this model is in the hot steel mill Outokumpu Stainless AB in Avesta (formerly AvestaPolarit). The task was to identify which steel coils are at risk of surface damage (or 'slivers'). There were about 270 attributes to consider, both continuous and discrete. Furthermore, it turned out that different steel types had significantly different sensitivities to slivers.
In this case we used the hierarchical graph model at its extreme. We built a mixture with one model for non-sliver cases and one model for sliver cases, and within each of these we built a mixture model over each of eight different steel types. Within each of these we modelled the data over the 270 attributes with a graph model, and finally, in the graph model we sometimes had to make a joint model over one continuous and one discrete attribute, which was again realized as a mixture. So in effect we had a mixture model of mixture models of graphs of mixture models over the attributes. An overview of the model is shown in Figure 2. This seemingly complicated model manages to improve the accuracy twenty-fold in identifying which steel coils are at risk of getting slivers.
Link:
http://www.sics.se/iam
Please contact:
Anders Holst, SICS, Sweden
E-mail: aho![]() sics.se
sics.se