
 This issue in
Computer at the Microscope: Visualization and Analysis of Three-Dimensional Microscopy Data
by Wim de Leeuw
An important topic in biomedical research is the three-dimensional organization of cellular structures. Novel developments in microscopy, such as the ability to make three-dimensional scans, play a crucial role in this research. However, manual interpretation and analysis of such scans is difficult and time consuming. Imaging and image processing can play an important role in the analysis of such scans. CWI developed the Argos system, in cooperation with the Swammerdam Institute of Life Sciences (SILS). It helps biologists in the interpretation of the microscopy data using a combination of image processing, feature detection and visualization. The system can be applied to the detection and analysis of tumour cells and to research into chromatin structure. The new combination of quantitative analysis and visualization techniques is a powerful tool for the understanding of microscopy data.
|
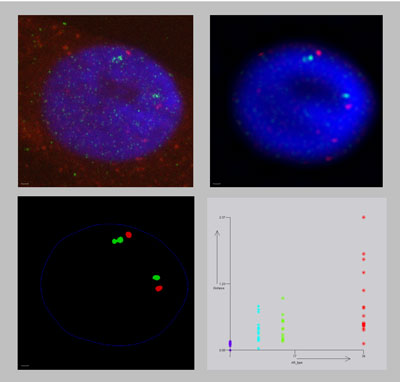
Laser scanning confocal microscopy (LSCM) allows biologist to scan fluorescently labeled specimen in three dimensions. The Argos system aims at the analysis of three dimensional volume data such as produced by LSCM microscopy. The system integrates quantitative analysis and visualization. Visualization is used to present extracted data as well as intermediate results. This enables close monitoring of the process. The analysis is based on the extraction of biologically relevant features from the data, using image processing techniques and attributes of these features such as size and roundness.
The analysis of biological data poses specific demands on automatic processing. Noise due to the imaging process and biological variation necessitates the analysis of collections of data sets and the ability to closely track the process. The software allows the inspection of intermediate results. Interactive feedback allows the user to trace back the results back to the raw data for example to spot problems in the used feature filters or an anomaly in a particular nucleus. For typical experiments tens of gigabytes of raw data are produced. During processing, relevant information with regard to the performed operations is stored for interactive inspection later on. Argos offers image processing, feature detection and quantitative information extraction tools for the analysis of large volume data collections integrated with visualization. Using this combination of image processing and visualization, novel insights into the data can be gained.
An application of the system is the automated tumour detection in tissue samples. Currently, examination of tissue samples for tumours is done manually. The nuclei of malignant tumours can differ in various ways from the nuclei of benign tumours. The structure of the nucleus, for instance, can be more or less granular and those grains have different dimensions and densities. Argos uses image-processing techniques to quantify these characteristics based on images of the nuclei from the tissue samples. Pathologists can make much cheaper and more accurate diagnoses with these quantified characteristics than with images alone. Noise in images and natural differences between nuclei make a correct diagnosis difficult. The visualization possibilities of Argos make it possible to present various features of the investigated nuclei and to discriminate between healthy and sick cells.
Another application in which the system is used is the quantitative analysis of scientific experiments to determine structural properties of spatial cellular structures such as chromatin. Subtle differences in structure only can be deducted by the study of a collection of microscopic images. Such experiments involve a large number of scans, which have to be analyzed in a consistent manner. The analysis consists of a number of steps: filtering out the relevant features, detection of the features, calculation of attributes and statistical analysis of these attributes. Combining these steps in a single system allows close control over the entire process and tracking of the effects the various steps have on the final result.
Please contact:
Wim de Leeuw, CWI, The Netherlands
Tel: +31 20 5924320
E-mail: wim.de.leeuw![]() cwi.nl
cwi.nl
http://homepages.cwi.nl/~wimc