|
ERCIM News No.50, July 2002
|
Finding Dependencies in Industrial Process Data
by Daniel Gillblad and Anders Holst
Dependency derivation and the creation of dependency graphs are critical tasks for increasing the understanding of an industrial process. However, the most commonly used correlation measures are often not appropriate to find correlations between time series. We present a measure that solves some of these problems.
Today, many companies keep close track of their systems by continuously recording the measurements of a large amount of sensors. At the same time, the hard competition in many of these industries leads to a need to increase the knowledge of the process for further optimization. Much of the recorded data is in the form of time series, ie sequences of observations indexed by the time at which they were taken. To gain thorough insight into the process, an understanding of how each measured sequence affects the others is necessary. More specific, the general task is to find how strongly the time series are correlated to each other, how long the time lag is between the correlations and, if possible, the causal direction.
For example, consider a process where you would like to find out how long it takes for material to flow from one point in the process to another. Injecting tracing substances and measuring the time directly might be expensive, difficult and interfere with the process in a negative way. Instead, it might be possible to measure two related variables, for example temperature, at the two points in the process and find out the time lag between the strongest correlations. This time lag can then give a very good indication of how long it takes for material to travel from one point to the other.
There are a number of applicable correlation measures, the perhaps most common one being the correlation coefficient. Unfortunately, many correlation measures, the correlation coefficient included, do not consider the specific properties of time series. Therefore they give a too smooth correlogram to be practically useful and are not sensitive and exact enough to determine the delay. Here, a measure based on the mutual information rate is described which solves some of the problems encountered using other correlation measures.
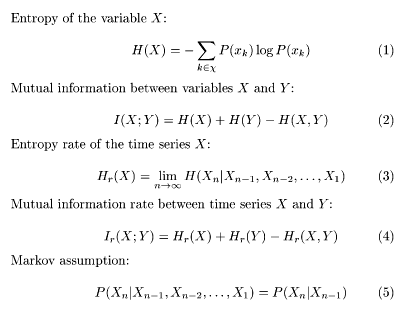
Mutual information is a general correlation measure that unlike the correlation coefficient can be generalized to all kinds of probability distributions. (The correlation coefficient assumes a Gaussian distribution.) Mutual information is based on the information theoretic notion of entropy, (see Eq. (1)), which is the expected amount of information given by a stochastic variable. The mutual information can be written as in Eq. (2) and be interpreted as the part of the information that is common to both variables. Given an appropriate model of the distributions, this measure can potentially detect non-linear dependencies between variables. However, it is still a general measure of correlation not specific for time series, with similar problems as the other general measures.
The problem with these is that in a time series, one value is not independent of the previous values. For example, the current value of a time series is probably close to the previous value. This means that several time steps contribute partly with the same information, which causes the general correlation measures to give too high values of the correlation. To construct a more sensitive and accurate measure specific for time series, we can instead use an expression for the amount of information that is new in each time step. This is the entropy rate given in Eq. (3). Using this we can also define the mutual information rate as in Eq. (4). This way, the mutual information rate measures the complete dependence between the sequences.
Working with finite amounts of data, the entropy rate in Eq. (3) is impossible to estimate perfectly. Using a Markov assumption (Eq. (5)) the information rate can be computed. Because of this, we also have to restrict ourselves to measuring influences with specific time delays between series. This means that we construct a correlogram measuring the direct dependencies between one series and the other for different time shifts between them.
 |
| Figure 1: Equations 1-5. |
 |
| Figure 2: correlograms generated for chemical plant data. |
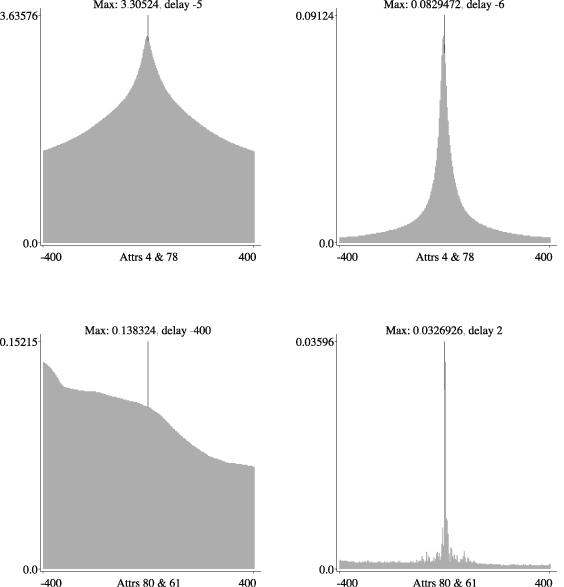
The measures presented here have successfully been used on several real data sets, mainly from a paper mill and a chemical plant. Figure 2 shows correlograms generated for chemical plant data. The correlograms to the left in the Figure show the mutual information and the correlograms to the right the mutual information rate between two different pairs of variables. In each correlogram, the x-axis represents the delay between the two series and the y-axis the degree of correlation between them.
The correlation between the first pair of variables (top) is an example of a well behaved, linear correlation with a short and reasonable time delay. The mutual information correlogram shows just one clear peak at delay -5, and the mutual information rate correlogram for the same attributes shows the same behaviour. Note that the correlation in the right Figure is much lower, which is closer to the truth than the high correlation to the left. The correlation is also much more sharply peaked at the correct time delay of the influence.
The correlogram for the linear mutual information between the second pair of variables (bottom) is very smooth, although somewhat low, but the measure is obviously fooled by some general trend in the data since it is constantly increasing with decreasing values of the delay. The mutual information rate on the other hand shows a clear peak at delay 2. That is a plausible value of the delay between the sequences, although the value of the correlation is rather low. The information rate diagram is not at all as smooth as the mutual information, showing several small spikes which are very likely effects of noise and oddities in the data. This is because the mutual information rate requires a more complicated model to estimate, and therefore is slightly more sensitive to noise.
Using mutual information or the correlation coefficient tends to give a too high value of the correlation. This happens because if the series evolve slowly enough, pure random coincidences between the series get multiplied with a factor depending on how slow the series are. The information rate, which only considers new information in every step, correctly compensates for this effect.
All in all, the mutual information rate gives more reliable indications of correlations between time series than the general correlation measures not specifically adapted for time series data.
Please contact:
Daniel Gillblad, Anders Holst, SICS
Tel: +46 8 633 1500
E-mail: dgi@sics.se, aho@sics.se
