|
|
|
||||||
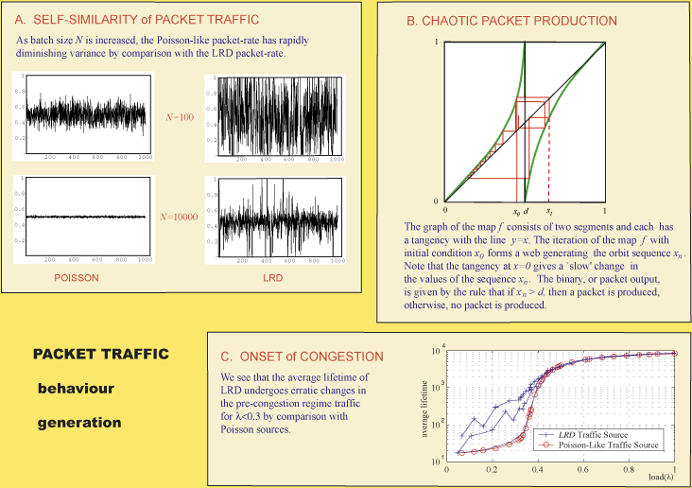
Nonlinear Modelling of Internet Packet Trafficby David K. Arrowsmith Nonlinear mathematics has recently been useful in creating packet traffic models for the Internet that can simulate the volatility of packet rates in a network on a range of time scales. The challenge of understanding the acute problems of congestion of packet traffic in Internet networks has been helped by the use of special types of chaotic map in the modelling process. Internet traffic was shown to exhibit self-similarity or long range dependence (LRD) by Leland and others in 1993. This behaviour manifests itself along a communication channel with bursty activity in the packet rate which persists on all relevant time scales. The phenomenon makes it difficult to implement effective traffic congestion protocols (TCP). The bursty nature of Internet traffic contrasts strongly with more traditional voice traffic, which is Poisson-like, and is known as short-range-dependent (SRD) traffic. In Figure A, we see examples which mimic the scaling of (a) short-range and (b) long-range dependent traffic for a time series of a random variable Xn, n = 0,1,2,... which takes binary values, ie Xn in 0,1, when averaged in batches sizes of N = 100 and N = 10000 in each case. The standard deviation in the SRD traffic varies as the square root of the batch size, or magnification, and we see a ‘smoothing’ of the traffic. This means that on aggregation, the mean is an increasingly effective indicator of the instantaneous load, ie expected packet rate, in the traffic. By comparison, in the LRD traffic, we see that the variation remains relatively high and even when averaged over longer time intervals, we still see the extreme rates 0 and 1 arising. The difference between these two types of traffic shows up in the nature of the auto-correlation decay. For memoryless traffic, the decay is exponential, whereas for LRD traffic, the decay is given by a power law. The functional form used for these packet generators was developed by Erramilli and others in the mid-nineties. The degree of the tangencies in the graph of f can be continuously changed to give varying types of traffic from Poisson (or memory-less traffic) to all levels of auto-correlation for LRD traffic. Simple network models can be created around this efficient packet production technique. The basic model has a lattice network of interconnected nodes which are either hosts (which can both receive or transmit packets) and routers which can only transmit packets. Packets when produced have another host destination. However, each of the network nodes has a buffer to store packets which cannot be moved immediately. When a packet arrives at the head of the queue, it then transfers to the queue at an adjacent node which is closer to its destination. One can consider in such models various performance factors such as average delivery time of packets, throughput of packets (ie packets received as their intended destination as function of packets sent). The most common control on the network is the adjustment of the packet rate of the hosts which feed the network with packets. Performance indicators, such as packet liftetime, can change so dramatically as load is increased that they can sometimes be best described by a phase transition. This behaviour is not necessarily the bad news that it sounds. If a critical load exists at which the delivery time of packets increases dramatically, then a clear control strategy to keep the load below criticality can be implemented. However, when the transition to congestion is less clear-cut, as for LRD traffic, then the control strategy becomes much more problematical. Our current investigations show up the latter problem very clearly. Direct comparisons of Poisson and LRD traffic in the same network and with the same load profiles show in Figure C similar network characteristics away from the congestion transition but wildly different behaviour around the onset of congestion region.
Immediate projects are to check the robustness of our results on other regular networks and extend the investigations to more realistic Internet networks. A joint EPSRC funded project began in April 2002, involving Queen Mary and the University of York, and it will investigate the different sources of LRD in a packet traffic network and assess their relative importance. Please contact: |