

ERCIM News No.44 - January 2001 [contents]
ERCIM News No.44 - January 2001 [contents]
by Pavel Slavik, Frantisek Hrdlicka and Ondrej Kubelka
Computer graphics in last years has been used in many new application areas. Its use allows the user to investigate many phenomena in very detailed ways that was not possible before. Many applications are linked-up with simulation processes and computer graphics is used to visualize results of these simulations. In the project described further we deal with a specific application where the use of computer graphics (namely its visualization capabilities) is rather new.
The project GACR 101/99/0647 (Simulation model of filter with vertical moving layer) is solved in collaboration between the Czech Technical University (Department of Fluid Dynamics and Power Engineering and Department of Computer Science and Engineering) and the Institute of Chemical Technology in Prague.
The project was targeted to the simulation of moving granular bed that has cleanup filter. These filters are used mainly in new combustion technologies that increase the efficiency of the electricity production process. The coal is processed by means of special technology that converts it into gas. This gas before it is used in boilers must be purified. One of the most used purification technologies is based on the moving granular bed gas cleanup filters.
These filters consist in principle of a filter body (that might have a various shape that influences the efficiency of the cleaning process) and from the large number of spherical granules that fill the volume of the filter body. The gas that has to be cleaned goes under pressure through this volume of granules. Due to their absorption capabilities the granules remove the polluted part of the gas. In order to remove the granules that have reached their level of saturation and thus are not able to absorb more pollutants the whole volume of the filter (virtually all granules) are moving downwards to the lower outlet. The saturated granules are continuously removed from the filter and the new (clean) granules are added through the top filter inlet.
Design of these filters is rather complicated as there are many parameters that influence the efficiency of the cleaning process. The most important ones are the speed of the granules within the filter, shape of the filter and absorption capability of granules. Especially the shape of the filter is of a key importance as it determines the size and location of stagnant zones where granules do not move with appropriate speed or they do not move at all. The existence of the stagnant zones decreases efficiency of the cleaning process as the saturated granules are not removed from the filter (either at all or very slowly). To achieve some kind of optimal solution it is necessary to establish proper filter shape and appropriate velocity values that lead to optimal performance of the filter.
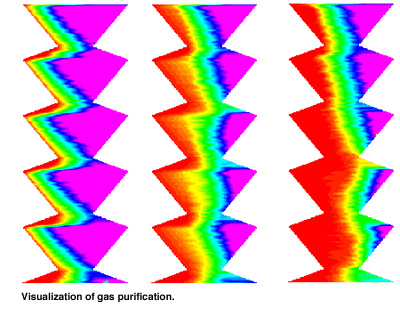
Traditional approach to the filter design is to construct a physical model of such a filter and perform set of measurements on this model. It is obvious that this solution is expensive and also time consuming. Solution to this problem is to develop a computer model that contains both simulation and visualization part. In our project there was developed a model based on the use of discrete element method. The algorithms developed were designed for 3D environment what allows the user to extend the system capability to investigate the gas flow in 3D (and thus to investigate absorption conditions in any place of the filter). Also areas where stagnation zones can occur are easily detectable. In order to prove validity of the model it was necessary to compare results obtained by means of the model with real results measured on the physical model. The real data were obtained from National Taiwan University where the physical experiments have been performed for quite a long time. The results obtained by means of simulation (and subsequent visualization) were very encouraging. The match was very good see the figure. It is possible to see how group of granules is moving through the filter (and how the initial volume of granules is distributed in the filter volume within certain period of time). Having this sort of simulation and visualization tool it is possible to design in very quick and effective way the described type of filters. It is possible to experiment with various shapes of filters and various speeds of granules in the filter.
The system has been implemented in C++ programming language for MS Windows9X/NT platform.
Please contact:
Pavel Slavík - Czech Technical
University
Tel: +420 2 2435 7480
E-mail: slavik@felk.cvut.cz