

ERCIM News No.44 - January 2001 [contents]
ERCIM News No.44 - January 2001 [contents]
by Andreas H. König and Eduard Gröller
Three years ago a research team at the Vienna University of Technology joined forces with a development division at Tiani Medgraph (one of Europe’s leading companies in Picture Archiving and Communication Systems) in order to develop a medical 3D workstation. Today this comprehensive software tool changes the way radiologists and other medical specialists diagnose and treat health problems of patients. Two examples out of the variety of new techniques (Virtual Endoscopy and the specification of transfer functions for Volume Rendering) are discussed in this article.
For purposes of medical diagnosis it is most desirable to have available as much detailed information on the anatomical and pathological features of the patient as possible. In clinical practice examinations by the various scanning modalities (like Computed Tomography (CT) or Magnetic Resonance Imaging (MRI)) try to find the optimal trade-off between a high scanning resolution and the radiation harm or inconvenience for the patient. With the recent rise of modalities featuring high spatial scanning resolutions (like Multi-Detector CT), special strategies for the investigation of huge data sets are more necessary than ever.
Traditionally, a radiologist supposed to diagnose such data sets would look at the scanned images slice by slice. By mentally reconstructing the sampled information into a three-dimensional representation, he would judge on the health of the patient. This procedure requires the radiologist to have well-founded experience as well as a highly sophisticated understanding of human anatomy. To create a ‘complete’ mental image of the patients structures, the radiologist has to take all available slices into account. It is obvious, that looking at hundreds of slices (and soon thousands!) is way too time-consuming for a single patient. Although these new modalities provide for the very first time ever reasonably enough information to find even small (and still curable!) pathological structures, it has become impossible to do the diagnosis the traditional way. 3D Medical visualization can help to overcome this problem by providing the user with a 3D representation of the patients anatomy reconstructed from the set of image slices. Two examples for the application of medical visualization are discussed in the following sections.
Virtual Endoscopy
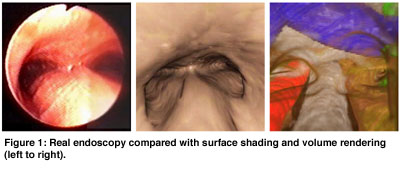
Virtual endoscopy is an application which deals with the exploration of hollow organs and anatomical cavities using volume data. Using a real endoscope is always painful or at least inconvenient for the patient. Virtual endoscopy is used as a non-invasive diagnostic technique. It may also be applied in surgical planning, training and exploration of structures not reachable with a real endoscope. All these fields have similar requirements concerning the visualization system : accuracy, intuitive interaction, fast visualization, and a short preprocessing time.
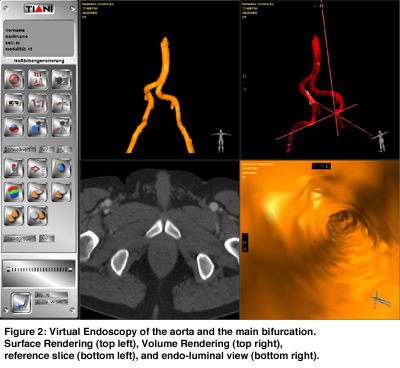
The common approach for the visualization of a virtual endoscopy is surface rendering, yielding images close to a real endoscopy. If external structures are of interest, volume rendering techniques have to be used. These methods do not display the exact shape of the inner lumen very well. For certain applications, eg operation planning of a transbronchial biopsy, both, the shape of the inner lumen as well as outer structures like blood vessels and the tumor have to be delineated. A new method has been developed, that allows a quick and easy hybrid visualization using overlays of different visualization methods like different surfaces or volume renderings with different transfer functions in real time on a low-end PC. To achieve real time frame rates, image based rendering techniques have been used. Virtual Endoscopy images are shown in Figures 1 and 2.
Advanced Transfer Function Specification
When employing direct-volume-rendering for the visualization of volumetric data sets, typically a transfer function is used to classify the data. Data values are mapped into optical properties like color or transparency information. Especially medical doctors with little experience in computers or the mathematical background of volume rendering are usually not able to handle complex paradigms for specifying the high-dimensional functions needed for the visualization. Therefore a new user-interface paradigm for the specification of transfer functions has been developed. The specification is usually a difficult task as mapping information for a number of different domains (data range, color, opacity, etc.) has to be defined. In the new approach, the definition of the mapping information can be realized independently for each property domain. A set of specification tools is provided for each domain, enabling users with different levels of experience or demanding time restrictions to choose an appropriate approach for their needs. Real-time feedback during the manipulation of parameters has been proven to be crucial to the specification.
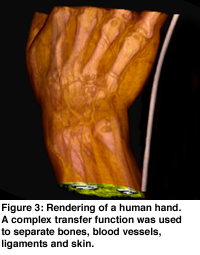
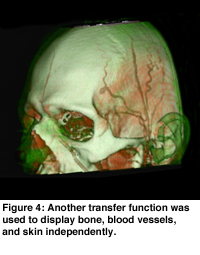
An interactive direct-volume-rendering display is realized by utilizing dedicated hardware acceleration. Figures 3 and 4 show examples of direct volume rendering displays utilizing transfer functions specified with this technique.
Conclusion
Just two examples from a variety of approaches included in the developed software system were presented here. Other applications include cardiovascular imaging, transplantation-surgery planning, orthopedic diagnosis and surgery planning, neuro-radiological applications, vascular diagnosis and treatment planning, and a lot of other specialized techniques. One of the future goals of computer aided diagnosis using 3D visualization is the establishment of screening examinations. If technology is evolved enough, every person in our society will spend a couple of minutes per year in a scanning modality. The acquired data will be analyzed automatically by an computer system. Potential hazards to the patient’s health will be reported to medical experts, who will be able to detect and cure most diseases in time.
Links:
http://www.vismed.at
Please contact:
Andreas H. König and Eduard Gröller – Vienna University of Technology
Tel: +43 2236 3077 0
E-mail: koenig@cg.tuwien.ac.at