

ERCIM News No.44 - January 2001 [contents]
ERCIM News No.44 - January 2001 [contents]
by Julian Gallop
Rutherford Appleton Laboratory (RAL) uses visualization techniques on large amounts of data as a service to its scientists. Two research topics currently under investigation to maintain the quality of this service are the use of VR to support 3D visualization, and distributed co-operative visualization.
The main function of the CLRC is to provide large science facilities that cannot be placed in each UK university. RAL hosts a large particle accelerator which produces muons and neutrons, a synchrotron radiation source to provide X-rays and photons, a laser facility to provide pulsed light, and a large NMR facility to provide magnetic waves, all to probe the structure of matter. Once experiments using these facilities are designed they produce large amounts of data on the structure of samples of materials from various specialised detectors. We also host a large space science facility that serves earth observation data from satellites, and act as a data centre for particle physics data from experiments at CERN. These facilities produce vast amounts of disparate data that has to be integrated and investigated by teams of scientists throughout the UK and Europe. Part of that investigation involves hunting for novel or interesting phenomena in individual data sets, or more often in combining data sets from different detectors or facilities. To identify the novel or interesting in the mass of data available, visualization is a powerful technique, exploiting the human visual systemís ability to search and manipulate objects.
The use of VR to support 3D Visualization
Many computer-assisted visualization applications involve the use of 3D and are now sufficiently complex that additional assistance is needed. VR is one technology which promises to help in this since it uses all of the human visual system as it has evolved to detect moving objects in a three dimensional world, rather than just using interpreting static 2D images which is an artificial task at the best of times.
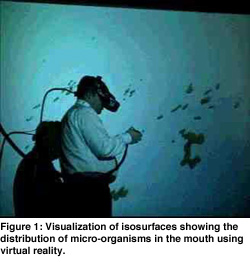
Studying micro-organisms in the mouth can involve investigating the presence and distribution of small regions where concentrations are high. If one represents this by isosurfaces, one has the visual task of inspecting and interacting with a collection of sparsely distributed blobs in 3D. Particularly when the number of separate objects is large, VR offers the ability to quickly perceive the 3D spatial relationships that are lost in a 2D presentation - see Figure 1.
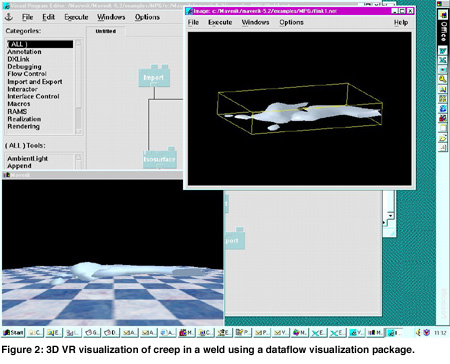
The behaviour of solid materials that creep when subjected to loading and high temperatures is a problem which requires the investigation of the inside of the material. When welds are involved, the problems are more complex. Computational techniques are becoming more reliable at making predictions, and improvements are being made, but the results need careful examination. Several parameters are examined including stress, strain and the extent of the creepage at any point. It is necessary to quickly identify critical regions within the materials and examine all relevant parameters that may contribute to the problem. A static 2D solution to this presents the information, but a moving 2D image allows the creepage to be captured over time. Further, a moving 3D image that the scientist can navigate through promotes the experience of change and allows scientists to identify critical regions, or more accurately, dismiss non- critical regions more quickly - see Figure 2.
Different system architectures have been used for data visualization. In these and other examples, a dataflow visualization system and a VR system have been combined. A visualization execution network is set up for the application in the usual way but with the addition of special modules that communicate 2-way with the VR system. The user then interacts with the 3D world through the VR system. The user has the advantages of VR, such as stereoscopic projection, time-critical rendering and 6 DOF input devices, and also the advantages of a dataflow visualization system, where alternative visualization solutions may be rapidly prototyped. In different projects using this approach, 3 different visualization systems (AVS, IRIS Explorer, IBM Open DX) have been used with two different VR systems (PTC Mockup & Manchester Universityís Maverik).
Distributed Co-operative Visualization
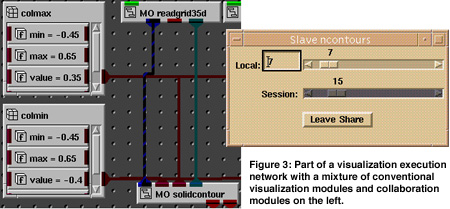
When data from different detectors must be combined, groups of scientists need to combine their complementary specialist knowledge to identify interesting phenomena. A previous project (MANICORAL) developed a prototype system that enabled dispersed scientists to collaborate on such an analysis through a common visualization. By basing the work on a dataflow visualization system, it was possible to develop modules that handled the necessary dissemination and arbitration. It was therefore possible to design visualization execution networks that handled the application requirements and the collaboration tactics - see Figure 3.
A current project (Visual Beans) takes this further by making use of Java and also component technology. It will build on work at Lancaster University (ADAPT project) which has adopted CORBA to solve certain problems of delivering continuous media, where adaptation to varying network and processor conditions is necessary. This development allows distributed scientists to combine components from different visualization systems and different display and navigation mechanisms to facilitate the integration of their knowledge without introducing the barrier of having to learn a specific novel visualization system favoured by another group or discipline.
Links:
MANICORAL: http://www.acu.rl.ac.uk/projects/manicoral.html
Visual Beans: http://www.acu.rl.ac.uk/VisualBeans/
ADAPT project: http://www.comp.lancs.ac.uk/computing/research/mpg/most/adapt.html
Please contact:
Julian Gallop - CLRC
Tel: +44 1235 44 5569
E-mail: Julian.Gallop@rl.ac.uk