Analytical Visualization of Spatio-Temporal Data
by Natalia Andrienko, Gennady Andrienko and Peter Gatalsky
How to show in a map characteristics of spatial objects or phenomena that vary in time? This has always been a challenge for thematic cartography. At present, when people deal with maps on computer screens more often than with printed ones, there exist much more opportunities than ever for visualization of time-related spatially referenced data. A screen map may display dynamics of phenomena through changing its appearance in real time.
Research on visualization of spatio-temporal data is being conducted at GMD in Knowledge Discovery Group of the Institute of Autonomous Intelligent Systems. The primary goal of the research is to develop such visualization techniques and tools that will support exploratory analysis of spatio-temporal data. In this it is different from other works that are more focused on the use of animated maps for presentation purposes, i.e. demonstration of previously known spatio-temporal trends and patterns.
Diverse tools for data analysis are needed depending on what kind of time-dependent characteristics are to be studied: existence, spatial location, geometry (shape and size), or thematic (attribute) data. Thus, studying development of cities, one may be interested when cities appeared or, possibly, which cities disappeared due to some disaster (existence), how the cities spread territorially (geometry), or how their population grew (attribute). For a beginning, we have focused on visualization of changes of spatial location.
Investigating movement of objects in space, an analyst may seek answers to different questions:
- what trajectories did the objects make during the whole time span considered?
- where was each object at a selected moment t?
- how did the positions of objects change from moment t1 to moment t2?
- what were the routes of the objects on the interval [t1, t2]?
- how did the movement progress with the time?
We have developed a visualization tool to support such an investigation. It offers the user various views on the data: overall view (the whole routes), instant view (positions at any selected time moment), interval view (route fragments made on the specified interval), and dynamic view (animation). Interactive exploration of data is enabled by special interaction control - time slider - which is connected to a dynamic map display. It allows the user to select time moments or intervals, move the display forth and back in time, or run animation. Animation may be regulated through a number of parameters. In particular, the analyst may select whether at each moment of animation the map presents instant, interval, or overall view.
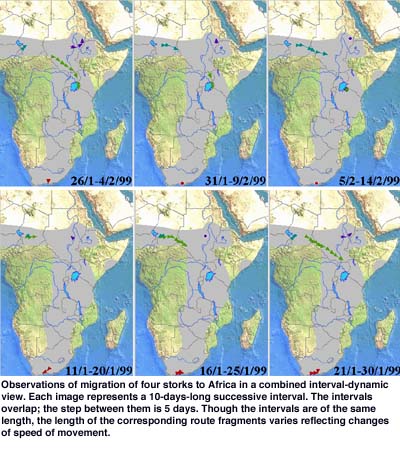
We tested our tool on an example data set containing telemetric observations of migration of four storks to Africa in autumn 1998 and back to Europe in spring 1999. In our tests we found especially interesting and useful combination of dynamic and interval views, i.e. the animation mode with interval view at each moment. In such a display object routes look like worms crawling on the map. It is not merely fascinating; these ‘worms’ help to study important dynamic characteristics of movement. The length of a ‘worm’ shows the speed of movement. Reducing of the length signalizes that the movement of the object slows down, growth of the length means that the movement becomes faster. When an object stops its movement and stays for some time in the same place, the corresponding ‘worm’ reduces to one point. All these observations would be practically impossible with usual animated presentations, which simply play a sequence of images showing states (in this case positions) at successive moments of time.
The figure demonstrates the combined interval-dynamic view. The shots represent six 10-days-long successive intervals. The intervals overlap; the step between them is 5 days. Though the intervals are of the same length, the length of the corresponding route fragments varies reflecting changes of speed of movement.
We invite the readers to explore the movement of the storks as well as test our tools to support this exploration by running the Java applet that is available at http://borneo.gmd.de/descartes/java/birds/index.html.
Exploratory techniques similar to those we designed for data about spatial movement can be proposed for other types of spatio-temporal data. We developed a variation of the above-described tool that deals with point observations, eg data about earthquakes (see example at http://borneo.gmd.de/descartes/java/show1field/eq.html) or nature observations made by schoolchildren (examples are available at the Naturdetektive project site, http://lo.san-ev.de/natdet/). At the moment we are creating interactive analytical techniques and visualizations for studying dynamics of attribute data, for example, demography or economic indices. This work will be further developed within the SPIN project (Spatial Mining for Data of Public Interest) accepted for funding in the IST Programme.
Links:
Homepage of the group: http://ais.gmd.de/KD/
Please contact:
Gennady Andrienko or Peter Gatalsky
Tel: +49 2241 14 2486/2261
E-mail: gennady.andrienko@gmd.de, peter.gatalsky@gmd.de